
This is the first in a series of posts where we explain the N50 (Nx) metric, discuss the problems surrounding it, give solutions to those problems, and suggest an alternative N50 metric for transcriptome assemblies.
Most genome assembly papers include the N50 statistics these days. This measure is often being used to describe the ”completeness” of a genome assembly (and sometimes other assemblies). But what it essentially does, is telling you some information about the distribution of contig lengths.
Many people struggle initially to grasp the concept of N50, but we like to picture it like this. Imagine that you line up all the contigs in your assembly in the order of their sequence lengths (Fig. 1, upper). You have the longest contig first, then the second longest, and so on with the shortest ones in the end. Then you start adding up the lengths of all contigs from the beginning, so you take the longest contig + the second longest + the third longest and so on — all the way until you’ve reached the number that is making up 50% of your total assembly length. That length of the contig that you stopped counting at, this will be your N50 number (Fig. 1, lower).

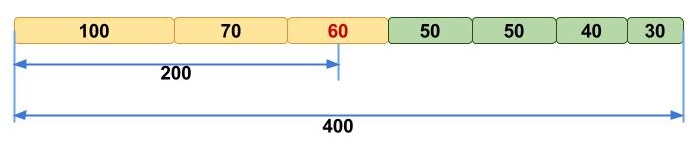
Upper panel: Contigs, sorted according to their lengths.
Lower panel: Calculation of N50 using sorted contigs.


