

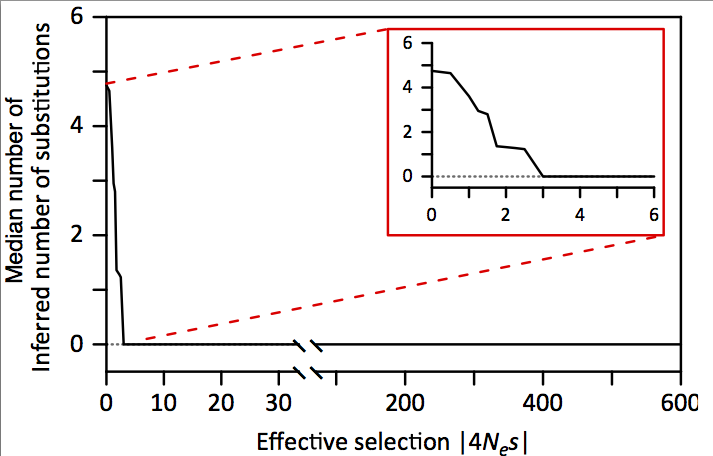
Figure 2. The evolution of several 100kb regions was simulated in 32 different mammalian species under varying strengths of selection |4Nes|. The number of substitutions in each region was then estimated using genomic evolutionary rate profiling (GERP). The plot shows the median across regions of the number of inferred substitutions. From the plot, it can be seen that, once the strength of selection exceeds a weak threshold value (3 for the example given), there is full conservation among species. Adapted from Lawrie and Petrov (2014).