

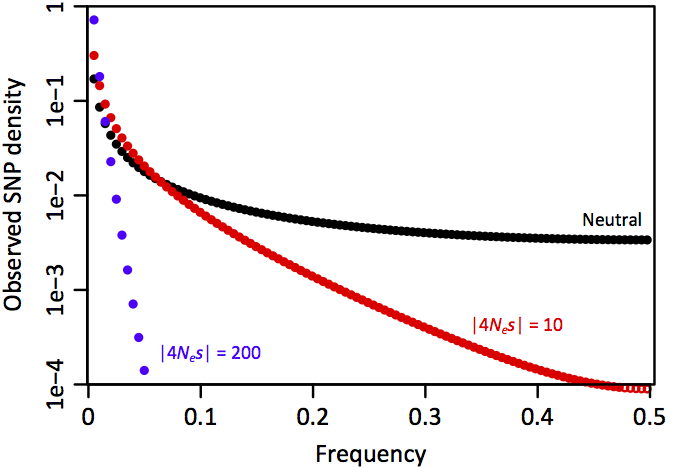
Figure 1. Using the site frequency spectrum (SFS) to quantify the strength of purifying selection. The SFS tabulates the number of polymorphisms at a given frequency in a sample of haplotypes. Under neutrality (black dots) many high-frequency polymorphisms are observed. Under purifying selection (higher values of the effective selection strength |4Nes|), a higher fraction of new mutations are deleterious, leading to fewer high-frequency polymorphisms (red and blue dots). Adapted from Lawrie and Petrov (2014).