

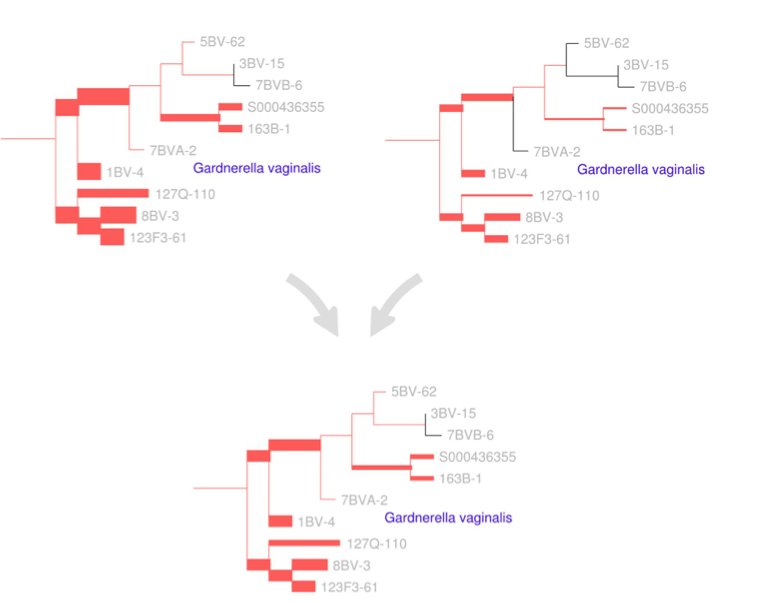
Figure 2. A visual depiction of the squash clustering algorithm.
When two clusters are merged, their mass distributions are combined according to a weighted average. The edges of the reference tree in this figure are thickened in proportion to the mass distribution (for simplicity, just a subtree of the reference tree is shown here). In this example, the lower mass distribution is an equal-proportion average of the upper two mass distributions. Similarities between mass distribu- tions, such as the similarity seen between the two clusters for the G. vaginalis clade shown here, are what cause clusters to be merged. Such similarities between internal nodes can be visualized for the squash clustering algorithm; the software implementation produces such a visualization for every internal node of the clustering tree. Note that in this figure only the number of reads placed on each edge is shown, although each placement has an associated location on each edge when performing computation. [Matsen & Evans 2013]