

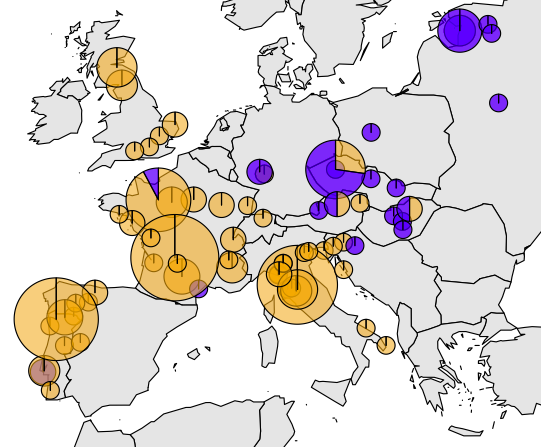
Plot pie charts on a map using ‘add.pie()’ in the ‘mapplots’ package.
add.pie(z=c(east, west), x=lon, y=lat, radius=sqrt(tot), col=c(alpha(“orange”, 0.6), alpha(“blue”, 0.6)), labels=””)
#z indicates the portions of the pie charts filled by each given type
#to properly plot all points, I run a loop to make one pie chart at a time; there are most likely more efficient methods