

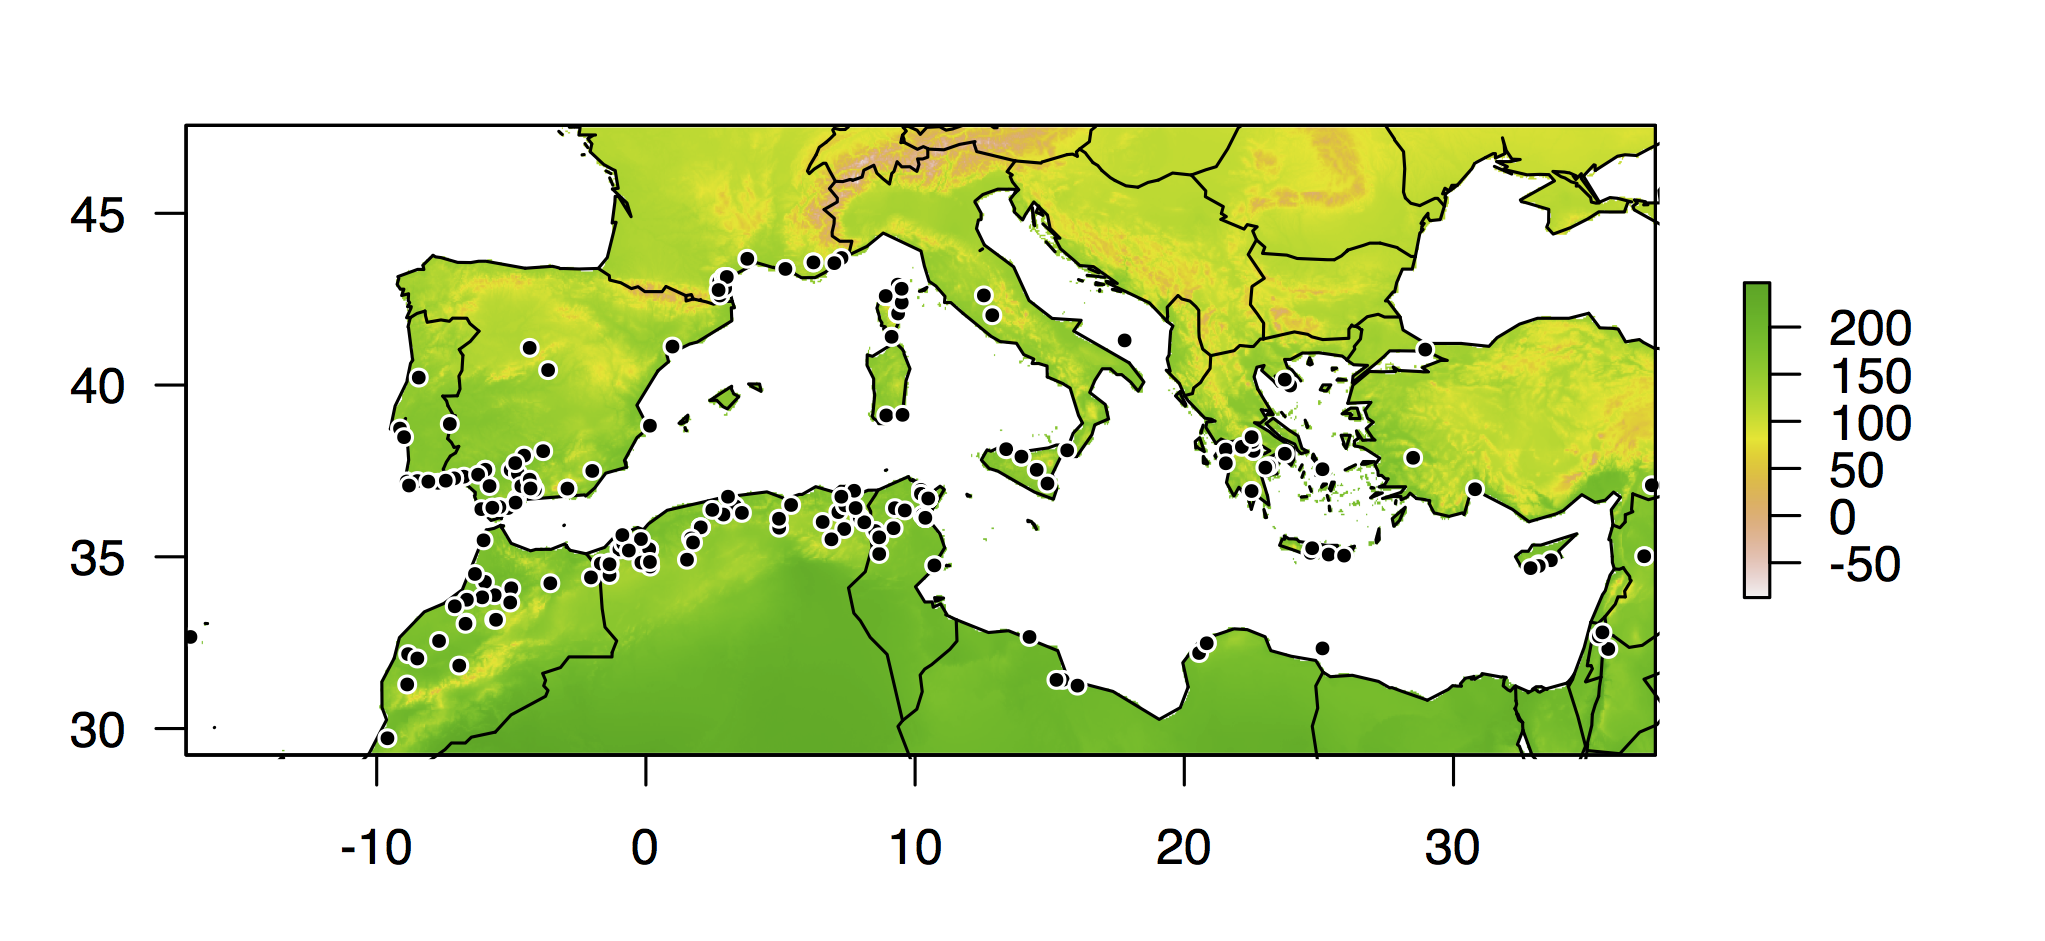
The sites of collection for plant lines in the HapMap panel (black points), with locations shaded by annual mean temperature, in ºC*10.
The sites of collection for plant lines in the HapMap panel (black points), with locations shaded by annual mean temperature, in ºC*10.