

One of the most obvious and important applications of evolutionary genetics is in figuring out whether natural biological communities are going to be able to adapt to global climate change. The projected rate of climate change over then next century is unprecedented in the evolutionary history of most living things, and we need methods to rapidly assess the genetic capacity of natural and cultivated populations to evolve in response to warming.
Genome scans for loci that are locally adapted to climate provide one tool for that assessment. Unlike traditional quantitative genetics methods, a genome scan doesn’t require cultivating the species of interest in controlled conditions. Instead, genome-wide marker data from a sample of natural populations can be used to find genome regions that are probably important for adaptation to climate, and these can be assayed for variation in populations threatened by changing conditions.
This is what’s known as a “reverse ecology” approach—it skips over the process of identifying specific traits that are important for surviving changing climates, and instead uses population genetic patterns to infer what’s going on. One approach for such a scan is presented in my latest paper, which is in this month’s issue of Genetics. Essentially I think of this as what you can do, given a lot of genetic data for a geographically distributed sample—in this case for barrel medick, or Medicago truncatula. Medicago truncatula is a model legume species, which has been used in a great deal of laboratory and greenhouse experimentation—but in this project, I tried to treat M. truncatula as a “field model” organism.
The Medicago Hapmap Project has assembled a panel of 288 selfing inbred lines of Medicago truncatula, and aligned Illumina DNA sequence data from each plant line to the M. truncatula reference genome. Depending on how that data is filtered, it identifies upwards of 6 million single-nucleotide polymorphisms (SNPs)—more than one SNP every hundred base pairs along the whole length of the 500 million-base-pair reference genome.
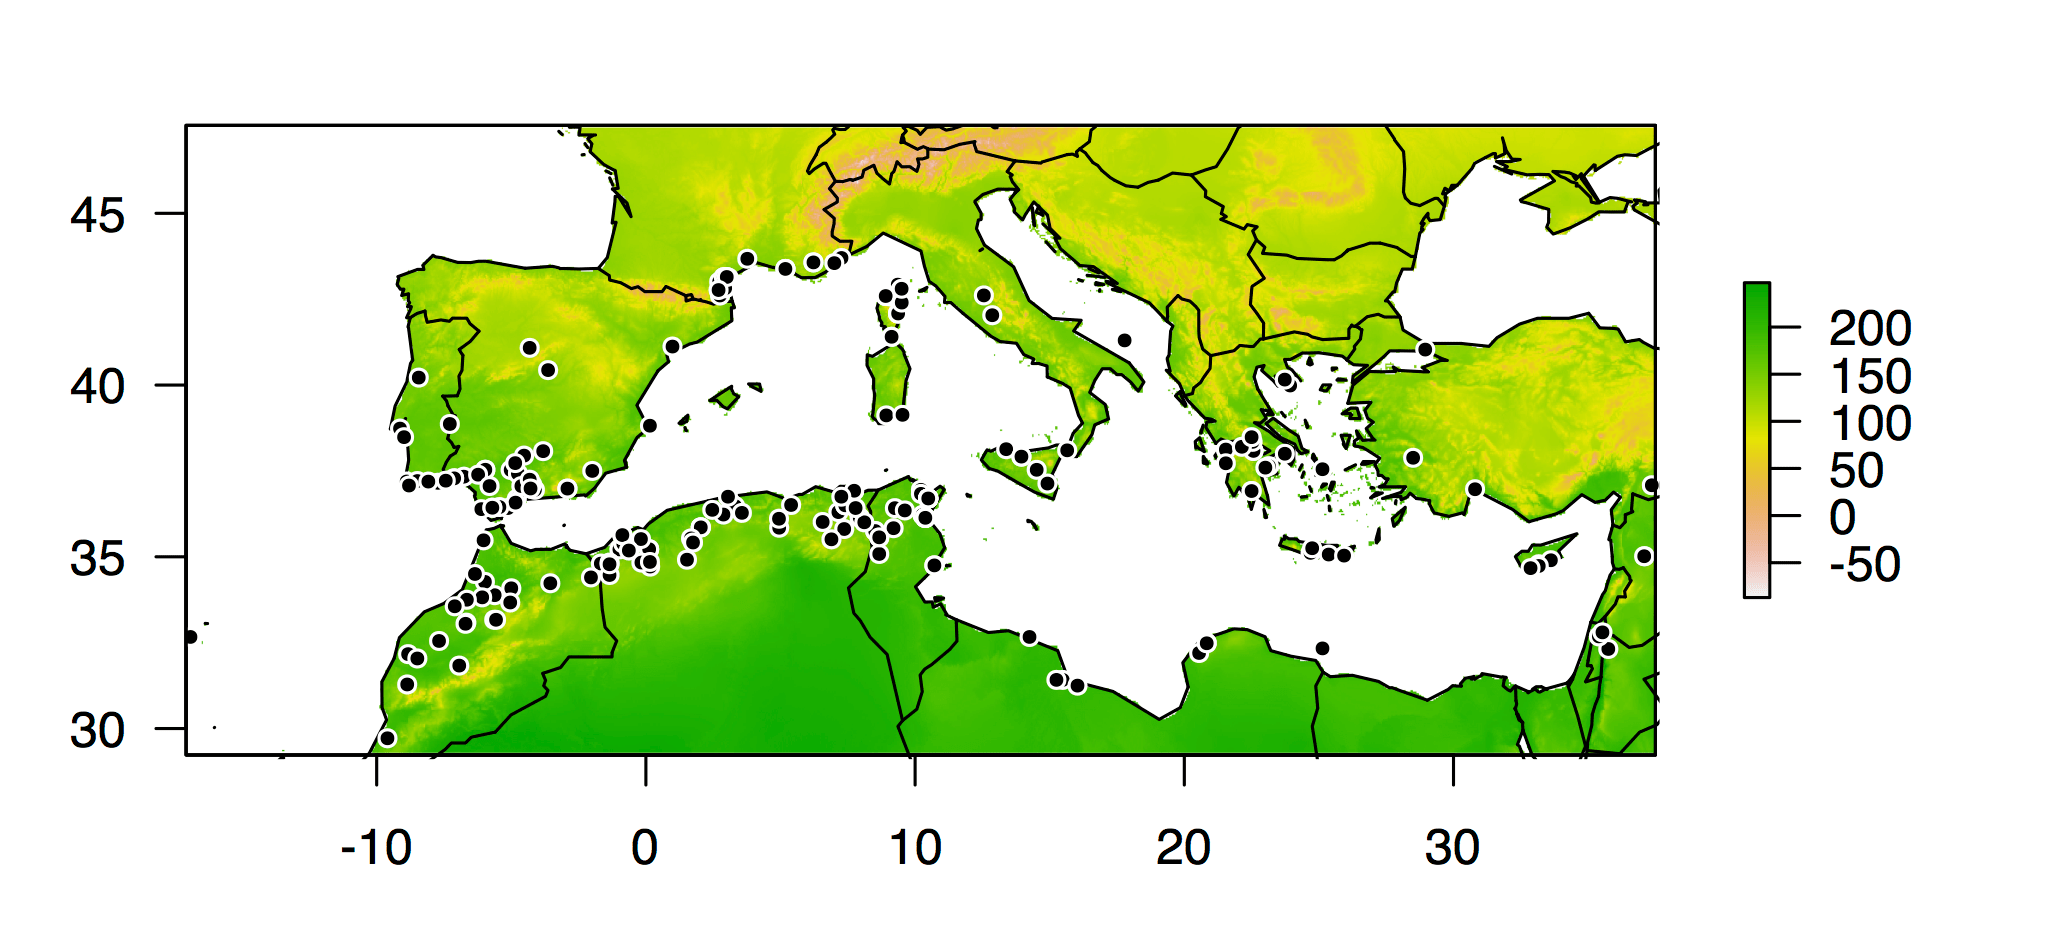
I dug into the information we had on every plant line in the HapMap panel, and with a little additional detective work, I worked out the latitude and longitude of the locations where 202 of the lines were originally collected. I used functions available in the dismo package for R to query the Bioclim climate database for temperature and precipitation conditions at all of those locations. And then I used that climate data like the phenotypes in a genome-wide association study.
That is to say, I used the method implemented in TASSEL to identify SNPs that showed strong association to temperature or precipitation at the sites of collection—SNPs for which, say, the annual mean temperature at collection sites for plant lines with one allele was strongly different from the annual mean temperature at collection sites for plant lines with the alternative allele.
Conceptually, this may seem a little bit odd, because the climate at the site where a plant line was collected isn’t really a trait of that plant line. It works, though, if we accept the assumption that the climate variation across the natural range of M. truncatula is a significant source of natural selection, and that some unmeasured traits of the plant mediate local adaptation in response to that selection.
Setting things up this way worked well for the manner in which the HapMap plant lines are distributed across the landscape, with every plant line treated as a separate observation, rather than grouped into populations. It also let me take advantage of the fact that TASSEL estimates association strength using a mixed linear model which can take a matrix of genetic distances as a co-variate—this can help to control possible conflation of local adaptation and isolation-by-distance.
I used this method to identify the SNPs with strongest association to annual mean temperature (AMT), precipitation in the wettest month (PWM), and isothermality (ITH; a measure of temperature variability). Somewhat encouragingly, many of these turned out to lie in genes with sequences similar to genes involved in drought and heat tolerance, regulation of stomata, and release of winter dormancy in other plant species.

As further confirmation for the functional role of genome regions identified in this “association scan,” I set up a experiment in a growth chamber, using the HapMap plant lines for which we had genetic data, but no climate information. I set the temperature in the growth chamber to the upper range of what M. truncatula would experience in nature, and kept the plants well watered—much wetter than their natural habitat. And it turned out that plant lines carrying more of the alleles associated with higher temperature and greater precipitation grew faster in the growth chamber:
Finally, I looked at patterns of sequence diversity near the candidate SNPs, and compared them to the genome as a whole. Compared to the rest of the genome, regions containing candidates for AMT and PWM showed increased differentiation between the alternate alleles of each SNP, as indicated by elevated FST, and reduced haplotype diversity, as indicated by elevated H12. This differentiation from the rest of the genome was apparent in candidate SNPs lying in gene-coding regions, but not for those in non-coding regions. Those patterns are consistent with a history of local adaptation acting on the genome regions identified by the association scan.

So in short, it looks as though this approach was able to identify genome regions with functional roles necessary for adaptation to climate. I wouldn’t necessarily endorse this as the best way to idenfity locally adapted loci—there are a lot of published methods out there for this kind of analysis, many of them designed with detection of local adaptation in mind, which is not really the case with TASSEL. (I’m actually working on a follow-up analysis to compare the power of the analysis described here to some of those other methods, so ask me about this in a few months.)
But, with that caveat, I hope this work helps improve our understanding of the population genomic patterns we should be looking for as we study—and try to preserve—natural populations responding to the biggest environmental experiment in human history.
References
Li YF, JC Costello, AK Holloway, and MW Hahn, 2008. “Reverse ecology” and the power of population genomics. Evolution. 62: 2984–2994. doi: 10.1111/j.1558-5646.2008.00486.x
Yoder JB, J Stanton-Geddes, P Zhou, R Briskine, ND Young, and P Tiffin. 2014. Genomic signature of local adaptation to climate in Medicago truncatula. Genetics. 196:1263-75. doi: 10.1534/genetics.113.159319