
This is the first in a series of posts where we explain the N50 (Nx) metric, discuss the problems surrounding it, give solutions to those problems, and suggest an alternative N50 metric for transcriptome assemblies.
Most genome assembly papers include the N50 statistics these days. This measure is often being used to describe the ”completeness” of a genome assembly (and sometimes other assemblies). But what it essentially does, is telling you some information about the distribution of contig lengths.
Many people struggle initially to grasp the concept of N50, but we like to picture it like this. Imagine that you line up all the contigs in your assembly in the order of their sequence lengths (Fig. 1, upper). You have the longest contig first, then the second longest, and so on with the shortest ones in the end. Then you start adding up the lengths of all contigs from the beginning, so you take the longest contig + the second longest + the third longest and so on — all the way until you’ve reached the number that is making up 50% of your total assembly length. That length of the contig that you stopped counting at, this will be your N50 number (Fig. 1, lower).

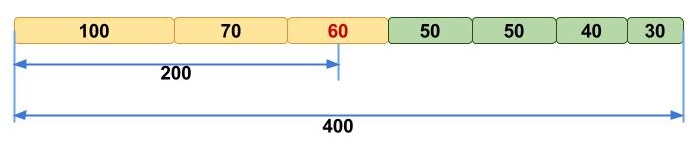
Upper panel: Contigs, sorted according to their lengths.
Lower panel: Calculation of N50 using sorted contigs.
Another way of thinking about it, is that at least half of the nucleotides in the assembly belongs to contigs with the N50 length or longer. And if you have scaffolds, you can calculate the scaffold N50 in addition to your contig N50.
What’s N90?
Likewise, you can think about other Nx values (e.g. N25, N80, N90) in a similar manner. With N90, instead of stopping to count at the 50% assembly length, you just stop at the last contig that includes at least 90% of the assembly length (Fig. 2).

Here N90 equals 40 kbp.
What’s L50?

Here L50 equals 3.
While N50 corresponds to the sequence length in base pairs, L50 represents the number of sequences. This is quite counter-intuitive and has therefore added a lot of confusion to these metrics. Since we order contigs according to their length while calculating N50, we can say that L50 is simply the rank of your contig that gives you the N50 length. For example, if you stopped summing up the sequence lengths at contig ranked number 345 in length order, your L50 would be this number.
The reason why N50 most often describes a length and not a number is because it was first described as such in the original human genome paper (Lander et al. 2001).
Next week, we’ll start to look into one of the problems associated with the N50 metric.
This post has been jointly written by Elin Videvall, Andrey Prjibelski, and Alexey Gurevich.
References
Lander et al. (2001) Initial sequencing and analysis of the human genome. Nature 409.6822: 860-921.